Contents
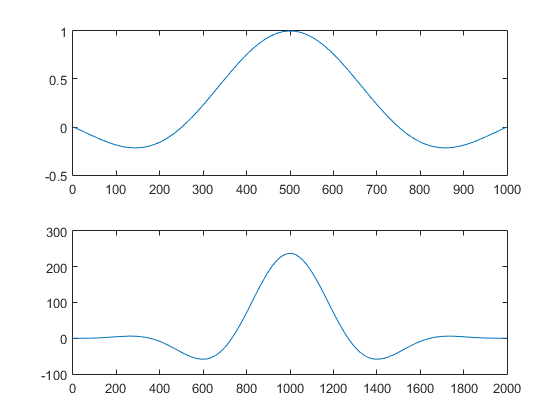
Demo of correlation function: x1 is a sinc function.
Because sinc function is symmetric, correlation and convolution give the same result.
clear all, close all

t = linspace(-2,2,1000);

x1 = sinc(t);

y1 = conv(x1,x1);

figure(1)
subplot(2,1,1)
plot(x1)
subplot(2,1,2)
plot(y1)
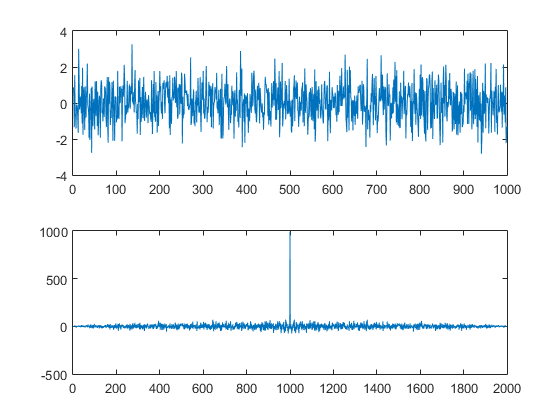
x2 is a random signal.
We use conv(x2, flipup(x2)) to actually calculate the correlation.
x2 = randn(length(t),1);

y2 = conv(x2, flipud(x2));

figure(2)
subplot(2,1,1)
plot(x2)
subplot(2,1,2)
plot(y2)